
Chronicles of the New Normal: An In-Depth Look at the New York Area Retail Economy
Let us imagine we are in 2021 and the world has left behind the worst of the COVID-19 pandemic. No doubt life has changed, and governments, companies, and individuals are adapting to a “new normal.” Our Chronicles of the New Normal series will help readers understand what is likely to be different in a post-COVID-19 world. We will also look at how players in the payments ecosystem are already adapting today to successfully emerge from this unprecedented shock to the economy and our daily lives.
This week, we focus on the evolution of retail spending in the New York DMA (designated market area). The New York City area is figuratively centered by the borough of Manhattan (i.e., New York County), inclusive of four additional boroughs (Brooklyn, the Bronx, Queens, Staten Island, respectively synonymous with Kings County, Bronx County, Queens County and Richmond County), and extends into suburban counties adjacent to New York City and portions of New Jersey and Connecticut. They combine to form the New York DMA, coterminous with the metropolitan New York area.
Within the U.S., this region is unique in many ways. It is less representative of the U.S. as a whole than many other cities. Yet, it is the undisputed business capital of the U.S. and watched closely by the world, which is why we wanted to take a closer look at the impact of COVID-19 on this singular area.
"What made the New York DMA unique before the pandemic will carry through in some similar ways and manifest itself in new ways during the post-pandemic recovery period."
We hypothesize that what made the New York DMA unique before the pandemic will carry through in some similar ways and manifest itself in new ways during the post-pandemic recovery period. Some businesses will revert to their pre-pandemic ‘business-as-usual,’ while new trends and opportunities will emerge for other retailers. As the evolution unfolds, the payments industry will continue to seek ways to provide consumers with what they’ve come to rely on: safe, secure, and convenient payment options.

COVID-19 in the New York DMA
The New York DMA has been one of the areas most affected by COVID-19, both in the U.S. and globally. This market has several unique attributes: population scale, density, diversity, concentration of multi-family dwelling units, reliance on public mass transportation (intra- and inter-county) and the presence of multiple international airports. All of these combined may have contributed to the accelerated spread of COVID-19 in the region.
In our analysis, we looked at two different phases of the pandemic:
Containment: During this phase, consumers experienced closures and low mobility.
Stabilization and Early Normalization: Consumers adapted to operating under restrictions while some businesses have begun to partially open as full lockdown measures are beginning to end.
Our analysis of our aggregated spend data provides unique insight into the evolution of retail in New York and its comparison to the rest of the U.S.
Containment
The pandemic’s economic impact on the New York region mirrored that of the entire U.S. in some ways and differed in other ways.
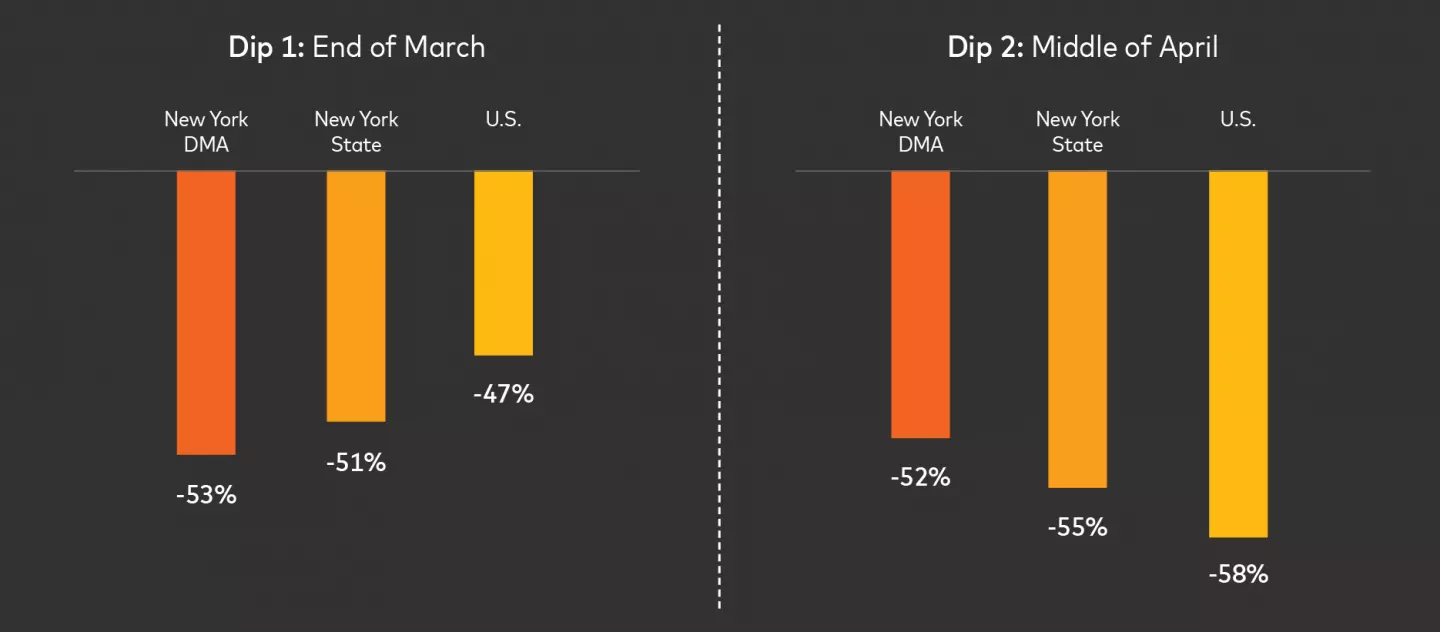
To understand spend activity during this period, we looked at Mastercard’s SpendingPulse™, which tracks overall retail sales across all payment types, including cash and check. A view of year-over-year change in spend comparing New York DMA, New York state, and the overall U.S. shows similar reductions. There were two significant dips in the year-over-year comparison:
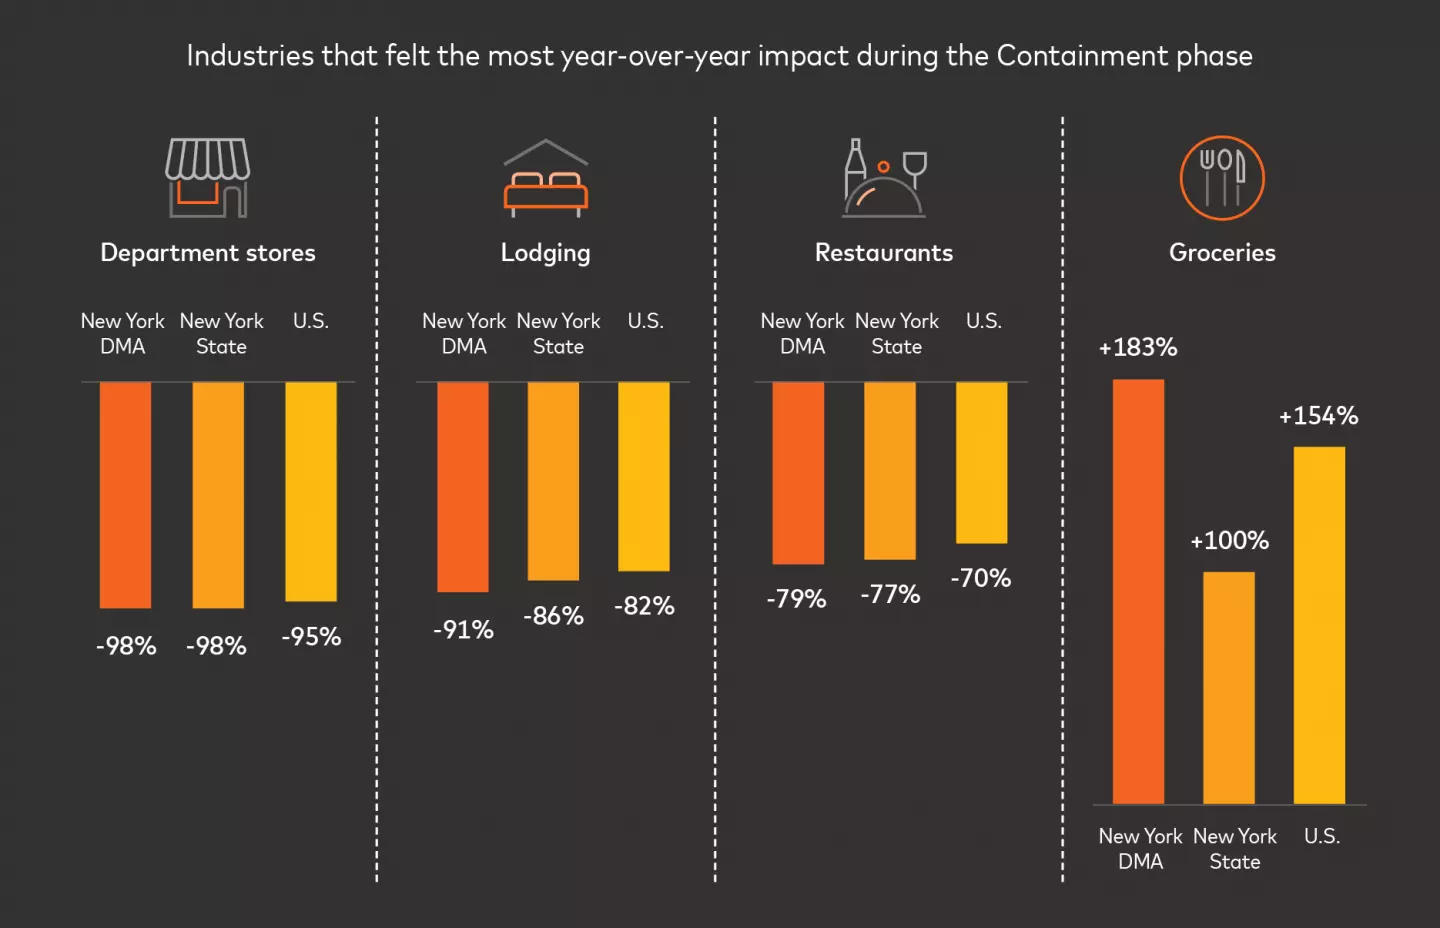
At the industry level, we see department stores, lodging, and restaurants as some of the most affected verticals:
Department stores were the hardest hit, with sales down 98% in New York DMA and the state and down 95% in the U.S. There have only been nominal improvements with a less dramatic drop of 85% for both New York DMA and the state and down 70% in the U.S.
Lodging was the second hardest-hit industry, with the lowest point being on March 28 for New York state, which was down 86% vs. the U.S., which was down 82%. March 22 was a low point for New York DMA, which was down 91% vs. the U.S., which was down 87%. Like department stores, there’s been little recovery, with New York DMA down 76% and New York state down 74% vs. the U.S., which was down 70%.
Restaurants in both New York DMA and New York state were harder hit than the rest of the U.S., with the lowest point happening on March 22. New York DMA saw a drop of 79% and New York state experienced a decline of 77%. The impact on the U.S. was a drop of 70%.
However, as expected, groceries experienced a year-over-year gain during this period.
Grocery spending in New York DMA appears to have benefited from large stockpiling between March 11 and March 22, with a peak of +183% in New York DMA and +154% in the U.S. on March 13. Grocery spending in New York state benefited for a slightly longer duration, from March 11 to March 28, with a peak of +100% on March 18. It should be noted that grocery spend is only up roughly +10% year-over-year post-stockpiling, despite the sharp 70% decrease in restaurant spend attributed to stay-at-home orders and restaurant closures.
Some industries outperformed previous spend levels in New York—a trend that differed from the rest of the U.S.
Electronics sales jumped in New York state +140% in two sales spikes in early and late April. As a comparison, Florida had a more muted increase of +19.4%.
Home furniture and furnishings reached a peak for New York state on April 20, increasing +34.6% year-over-year, whereas the broader U.S. remains below 2019 industry sales levels.
When further segmenting the data on a DMA level, the relationship between grocery and restaurant spend varies based on the New York sub-region. For example, across New York state, the grocery stock-up began one week before the restaurant trough.
However, within New York City, the grocery peak was not necessarily as predictive of the restaurant decline. New York City, including areas like Manhattan, saw the lowest grocery peak of +94.1% and was the only New York City borough below +100% growth. But it also had the lowest restaurant trough at -86.8%.
By contrast, the Bronx saw the most significant grocery peak of +171.0% and the second-highest restaurant trough at -69.7%. The steeper decline in restaurants may be attributable to the impact of fewer tourists, commuters, and business travelers. This is validated by New York County, which also saw the steepest drop in lodging through March.
Unsurprisingly, for New York, including Manhattan, total retail sales fell quickest and furthest among the five boroughs in New York City during the low mobility period. By March 31, the year-over-year 7-day moving average was down -49.2%, with steep but lesser decreases in the other four boroughs. This is, in part, attributed to some people migrating from the city temporarily.

Variances by county included differences in the timing of the impacts. New York County total retail sales declined quickly below the total U.S. year-over-year trend. This happened within days of the state of emergency declaration on March 7, which was well before the spike in COVID-19 cases.
However, surrounding counties (including the Bronx, Queens, Nassau) did not decline below the total U.S. trend until late March, around the time of the surge in COVID-19 cases. Kings County remained above the U.S. trend throughout March. This may lend greater evidence to both the spread of the virus emanating from an epicenter, as well as the impact of Manhattan-based tourism and business commutation.
More urban counties around New York City and Long Island saw worse declines in the immediate weeks following the stay-at-home order (weeks ending March 28 and April 4). In contrast, more rural upstate counties saw worse declines through mid-April (weeks ending April 11 and April 25). This harkens back to the epicenter of the pandemic initially residing in New York City and then expanding outward over time.
The impact of COVID-19 on tender type and payment form was also pronounced during the stay-at-home period. Cash use saw a precipitous drop in the U.S. year-over-year. Every month, there was an absolute cash volume increase of +5.7% in January and +6.5% in February. However, March cash volume dropped -26.7%, and in April, volumes dropped -41.7%.
Reductions were also evident in the share of cash versus point-of-sale debit use, which declined each month from January through April.
Stabilization and Early Normalization
Throughout May, retail spend in New York state and New York DMA has shown signs of normalization despite broad stay-at-home orders still in place. This trend has largely lagged the rest of the U.S. in both the New York DMA and broader state, with a few key exceptions (the Bronx, Rockland, Bergen).
Overall, the immediate New York metro area, not including the five boroughs, is normalizing fastest on average and in line with the rest of the U.S., relative to New York City and the rest of the tri-state area.
Total retail spend for New York state has increased to -3.7% year-over-year growth for the week ending May 16, up from the low point of -41% year-over-year growth for the week ending March 28. Despite this path to near neutral year-over-year growth, New York state ranks 40th or worse in year-over-year total retail growth relative to other states and Washington, D.C., for the last three weeks. New York DMA has fared similarly during this period.
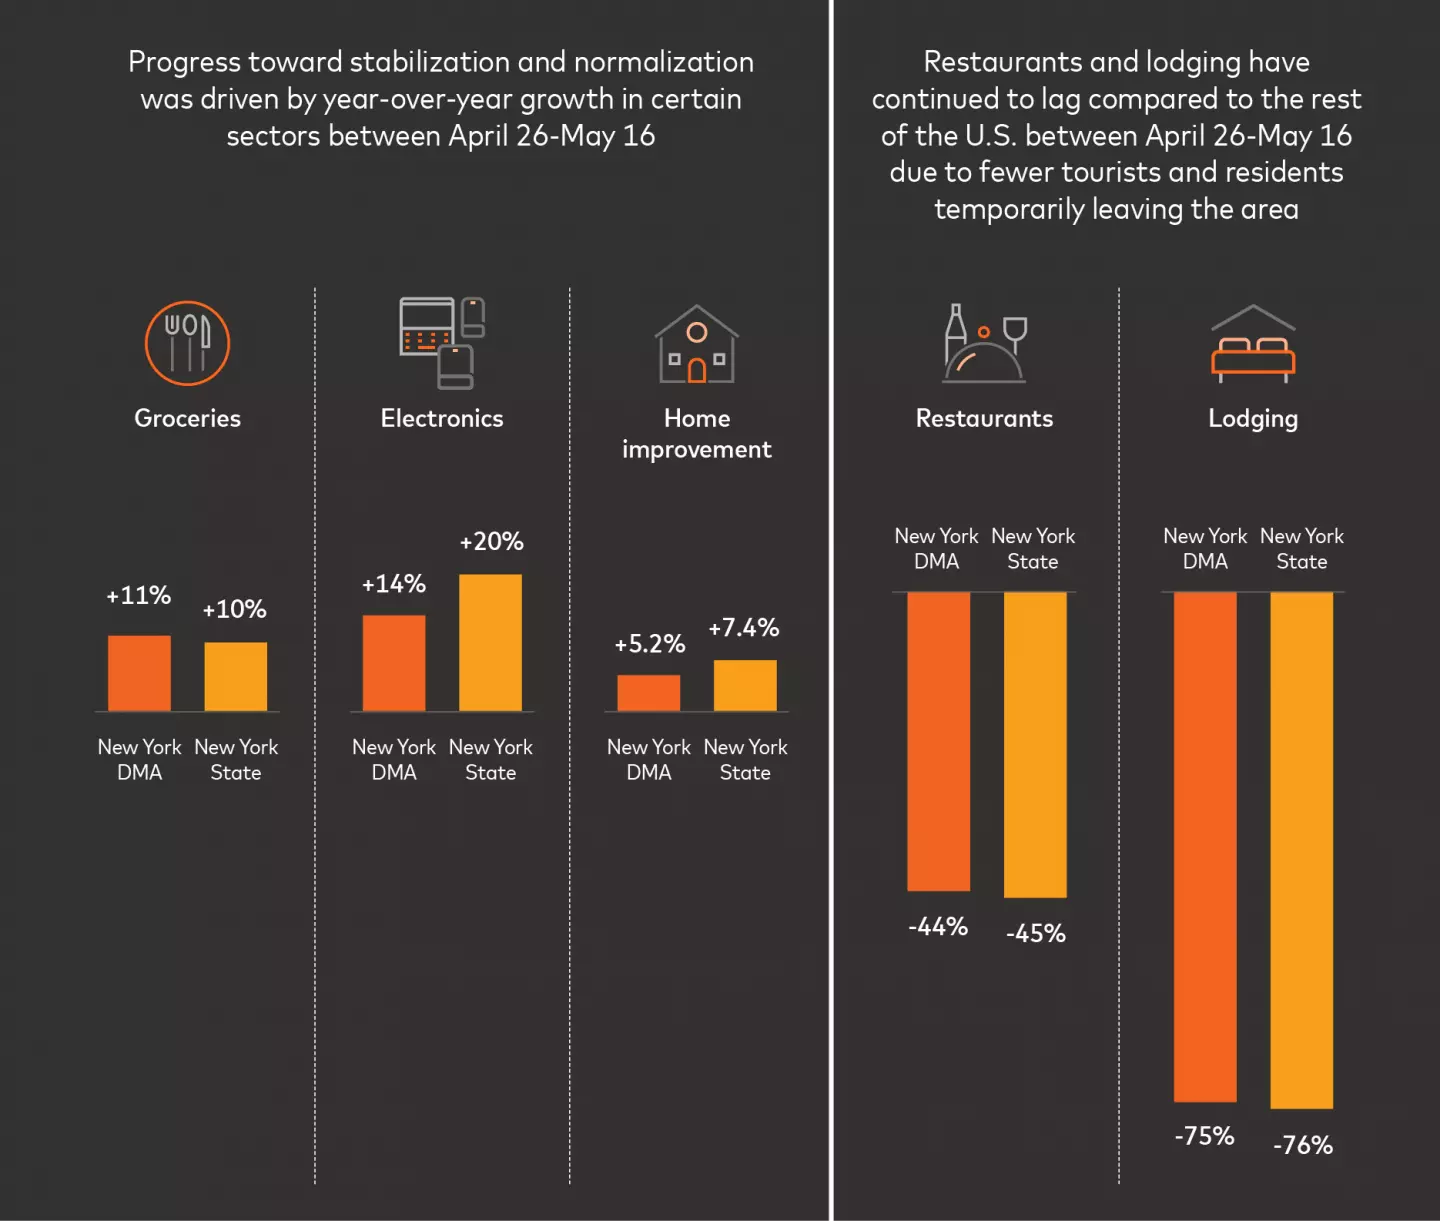
The normalization has been driven by strong year-over-year growth in grocery (New York DMA +11%, New York state +10%), electronics (New York DMA +14%, New York state +20%), and home improvement spend roughly in line with the rest of the U.S.
Furniture and furnishings sales in New York state and DMA have relatively outperformed other states and metro areas around the country (New York DMA +5.2%, New York state +7.4%). This has been driven by online sales given remaining restrictions on brick-and-mortar stores.
Restaurants (New York DMA -44%, New York state -45%) and lodging (New York DMA -75%, New York state -76%) have lagged the U.S., likely due to fewer tourists and the surge of residents temporarily leaving New York DMA.
Looking more closely at the New York metro area in the last weeks of May, the Bronx, Rockland and Bergen are increasing fastest, as the only three counties in the immediate New York metro to exhibit positive year-over-year total retail growth for the last two weeks combined. These counties are in the top half of counties nationwide for the last two weeks of May, with the remaining 16 counties that complete the New York metro, in the bottom half on retail spend growth.
Total retail spend recovery across the full tri-state area (-3.1%) is lagging compared to the rest of the U.S. (only down -1% year-over-year). New York City’s five boroughs (-3.8%) are increasing slower than the immediate surrounding New York metro area (-1.9%) in the most recent two weeks. The extended New York DMA area and generally the rest of the tri-state outside of the New York metro area are trending similarly at -3% to -4% year-over-year total retail growth.
"Some of the changes in consumer shopping needs and behaviors from the pandemic will likely remain into the near future, while others will diminish as brick-and-mortar shopping becomes an option again."
The data provided is, at its core, driven by changes in consumer shopping needs and behaviors. Some of these needs and behaviors will likely remain in the near future, while others will diminish as brick-and-mortar shopping becomes an option again.

It is remarkable how businesses with products or services affected by COVID-19 have found an opportunity to pivot. We’ve seen:
Clothing companies making face masks
Alcohol distilleries making hand sanitizer
Catering businesses offering direct-to-consumer meals
Fitness studios have moved their classes online, promising to offer the option to train virtually even as brick-and-mortar locations reopen
Uber has continued to offset a portion of its large drop in ride sales though their Uber Eats delivery service
Even restaurants have adapted to offering pantry pickup services instead of take-out after shortages of cooking and baking ingredients in grocery stores
These businesses will be well positioned to adjust their product offerings as the landscape continues to change. While some habits, such as large-scale stocking up, have benefited retail spend in the short term, other trends, such as those listed above, will continue to sustain retail spend as consumers take their time getting back to brick-and-mortar spending.
Considerations for Issuers
As spending habits evolve and new patterns emerge due to COVID-19, issuers are adapting their services to meet new consumer needs. Issuers have a history of providing safety, security and convenience through its payment operations, and are continuing to carry on that tradition through the pandemic. Some examples include:
Customers need electronic payment instruments more than ever, so issuers have reinforced their online acquisition and servicing channels.
Being able to use their card online or for their grocery shopping has become vital for customers. This has led issuers to enhance authentication and authorization processes to streamline the user experience and optimize approval rates, while at the same time, minimize fraud. Issuers have also made customers aware of how to use their card online and for relevant offers.
Contactless has also become an area of global focus, as a safer way to pay. Issuers and acquirers have played their part to facilitate contactless transactions.
Beyond these three examples, this difficult period for consumers has become an opportunity for financial institutions to show they care for customers and their financial and physical well-being in the framework of a long-term relationship.

A Closing Word
We have delved into the impact of COVID-19 on the retail economy in New York City and its surrounding environs to get a clearer picture into the post-COVID-19 new normal, which is just beginning to emerge. What makes the New York area unique within the U.S. may be representative of other select cities around the world. Each market may look for clues into its own situation through the lens of New York.
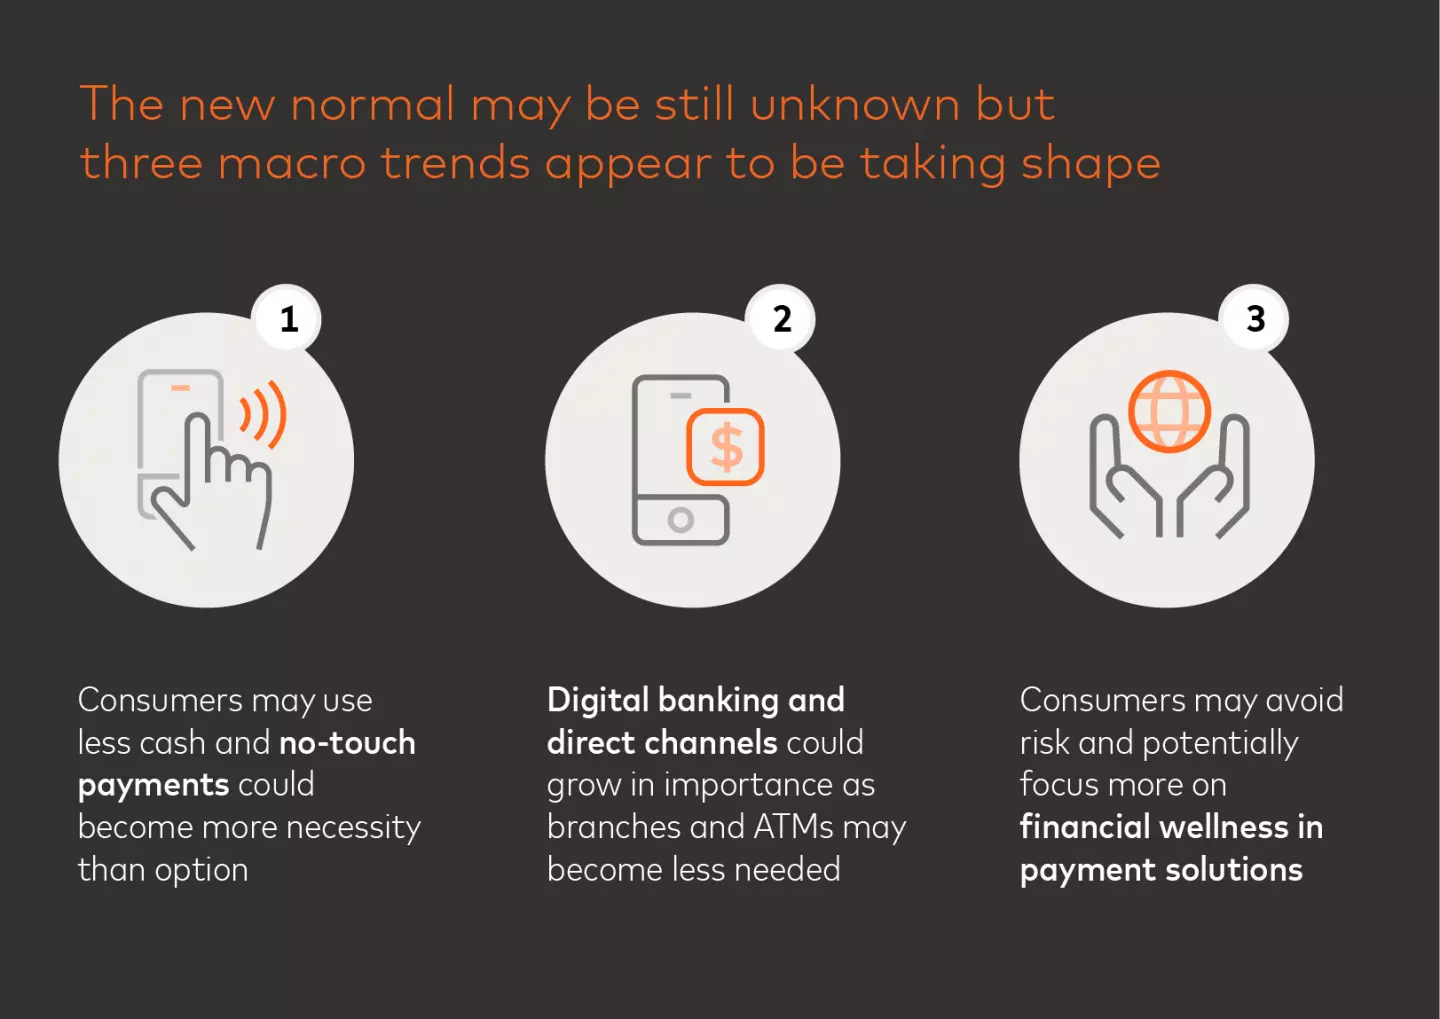
It is still early to say which of these changes to customer behaviors are temporary and which will become part of the new normal or how long the recovery will take. But we already see leading institutions planning scenarios with three underlying macro trends:
Lower Cash Usage: While there's been an increasing trust in e-commerce, no-touch forms of payment in brick-and-mortar stores will become the necessity, not an option. We may also see a bigger shift to virtual cards, seamless card-on-file solutions, and growth in self-checkout concepts.
Appetite for Digital Banking and Direct Channels: Large-scale customer preference and comfort with digital banking may lead to a transition away from branches and towards digital on-boarding and services.
Customer Risk Aversion: Consumers may become more risk averse and wary of interest, fees and revolving debt. There could be increased relevance in financial wellness, budgeting and installments incorporated in payments solutions.
Fully understanding the new normal and aligning to it will be key for institutions. They will need to position themselves to take advantage of these new behavioral changes as a result of this health and economic crisis.
Of course, these recommendations are broad, and every challenge and every organization is different. For more guidance on adapting to the evolution of customer needs within your business, reach out to Fabrizio Burlando or Raul Escribano.